
The Proactive Guardrail: Inside the Addesu Client Monitoring Dashboard
In performance marketing, silence is never good. A tracking pixel that breaks overnight or a billing card that expires on a Sunday can cost thousands in lost revenue before anyone even opens a laptop on Monday.
At Addesu, we believe paid media management is not just a set of hands managing accounts, but rather a proactive guardrail for your business. To do that, we built the Client Monitoring Dashboard, an internal powerhouse that ensures no budget is wasted and no error goes unnoticed.
As will be detailed, our Client Monitoring Dashboard helps us achieve 5 key things:
- Visualise volatility
- Detect unexpected zeros
- Hold real-time accountability
- Perform triple layer forecasting
- Have eight platforms in one place, sharing a single truth
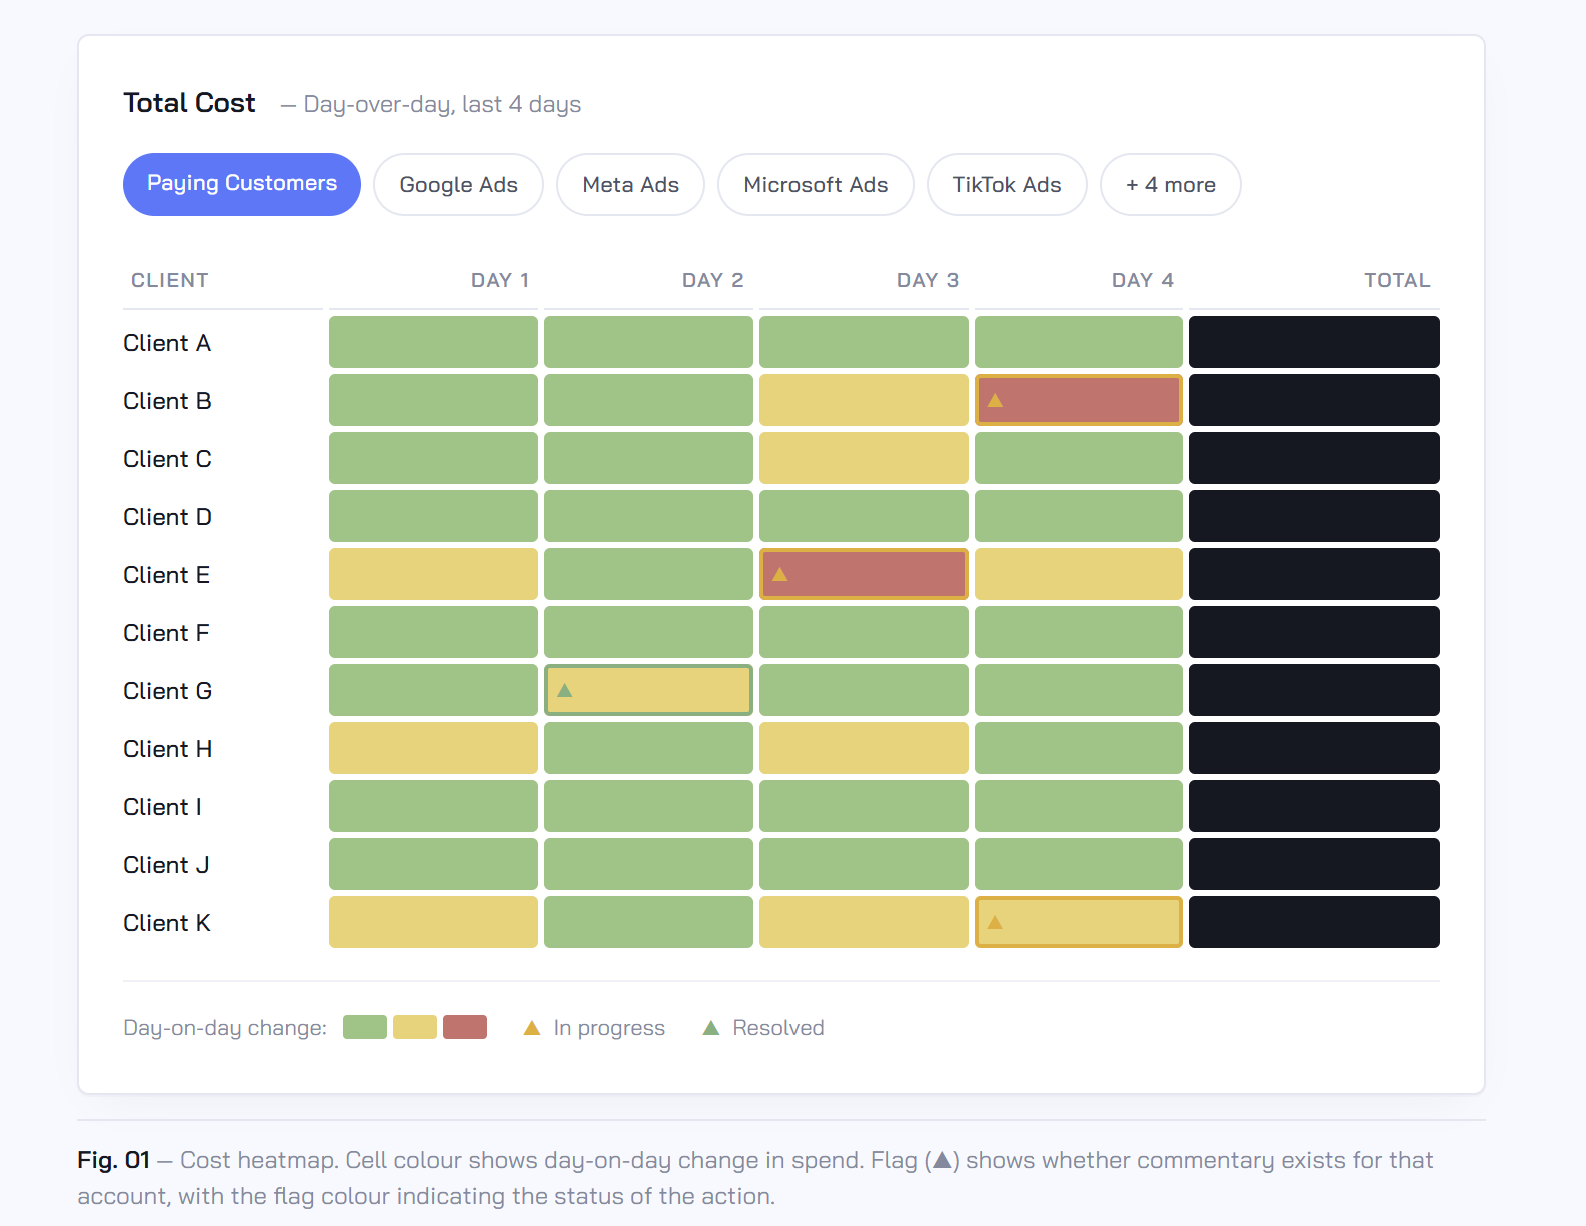
1) Visualising Volatility
Reading thirty rows of numbers every morning is a recipe for missing the details. Our main view tracks daily spend and key KPIs across the most recent four days, colour coded by day on day change.
The logic here is specific: the colour reflects movement, not absolute spend. A steady high spending account stays green, while a sudden swing, either up or down, surfaces as amber or red.
Because the eye picks up shifts faster than the brain reads numbers, our team can scan thirty accounts in five seconds. We catch the volatility before it becomes a trend, ensuring your capital is always allocated where it is actually performing.
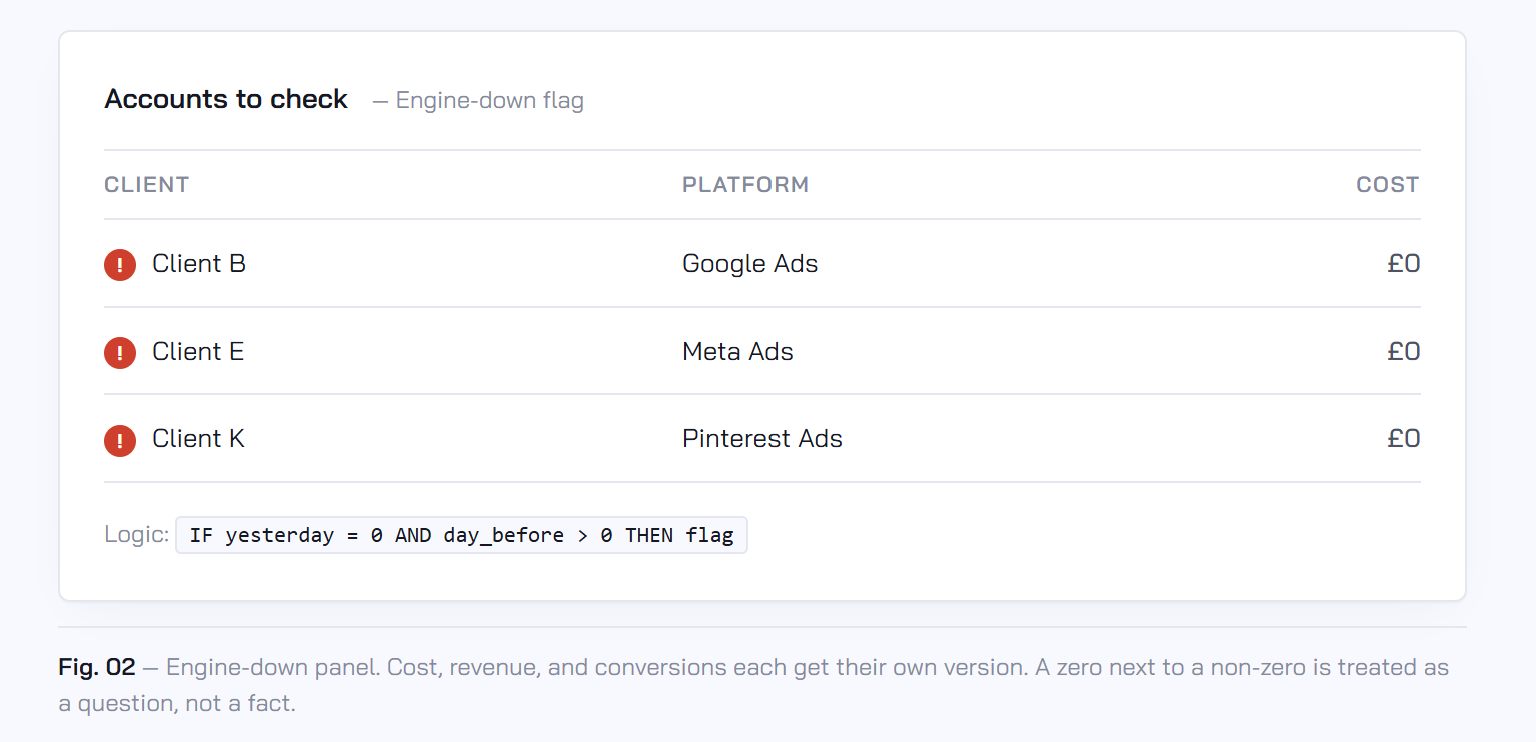
2) Detecting Unexpected Zeros
Technical failures are part of the digital landscape. A campaign pauses, a billing card expires, or an API connector fails. These silent kills can often go unnoticed until a report surfaces days later.
We built our Engine Down panel to stop those errors the moment they happen. The system runs a rigorous check for every account on every platform. It compares yesterday against the day before. If yesterday shows zero but the day before was active, it flags. We apply this logic to cost, revenue and conversions separately. Because our delivery team knows exactly what should be live, they can distinguish between a planned pause and a genuine data failure instantly. We spot the silence before it turns into a day of lost revenue.
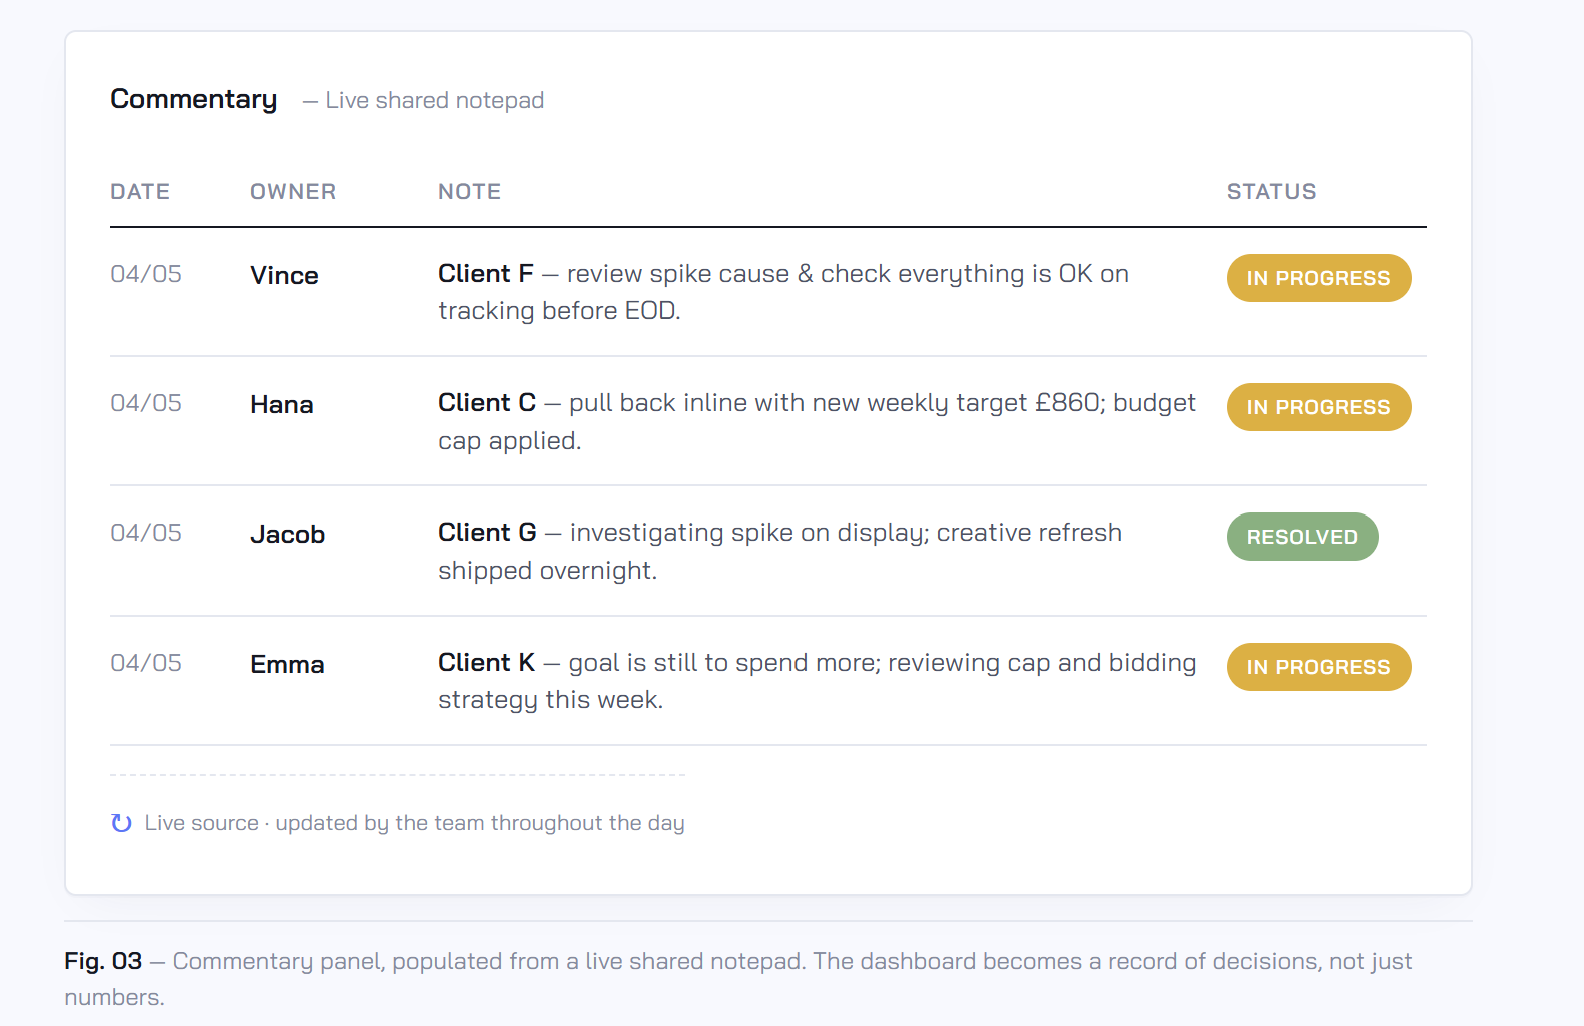
3) Real-Time Accountability
Data without context is just noise. That is why our dashboard includes a live commentary feed pulled from a shared notepad that our team updates throughout the day.
Each entry carries a date, an owner, the client and a status. These notes drive the flags you see on our heatmaps and create a permanent record of decisions so nothing is reviewed twice and nothing falls through the cracks. It means every team member has eyes on the same information at all times. Even if an account director is away, anyone stepping in has the full context of every recent optimisation so the quality of care never drops.
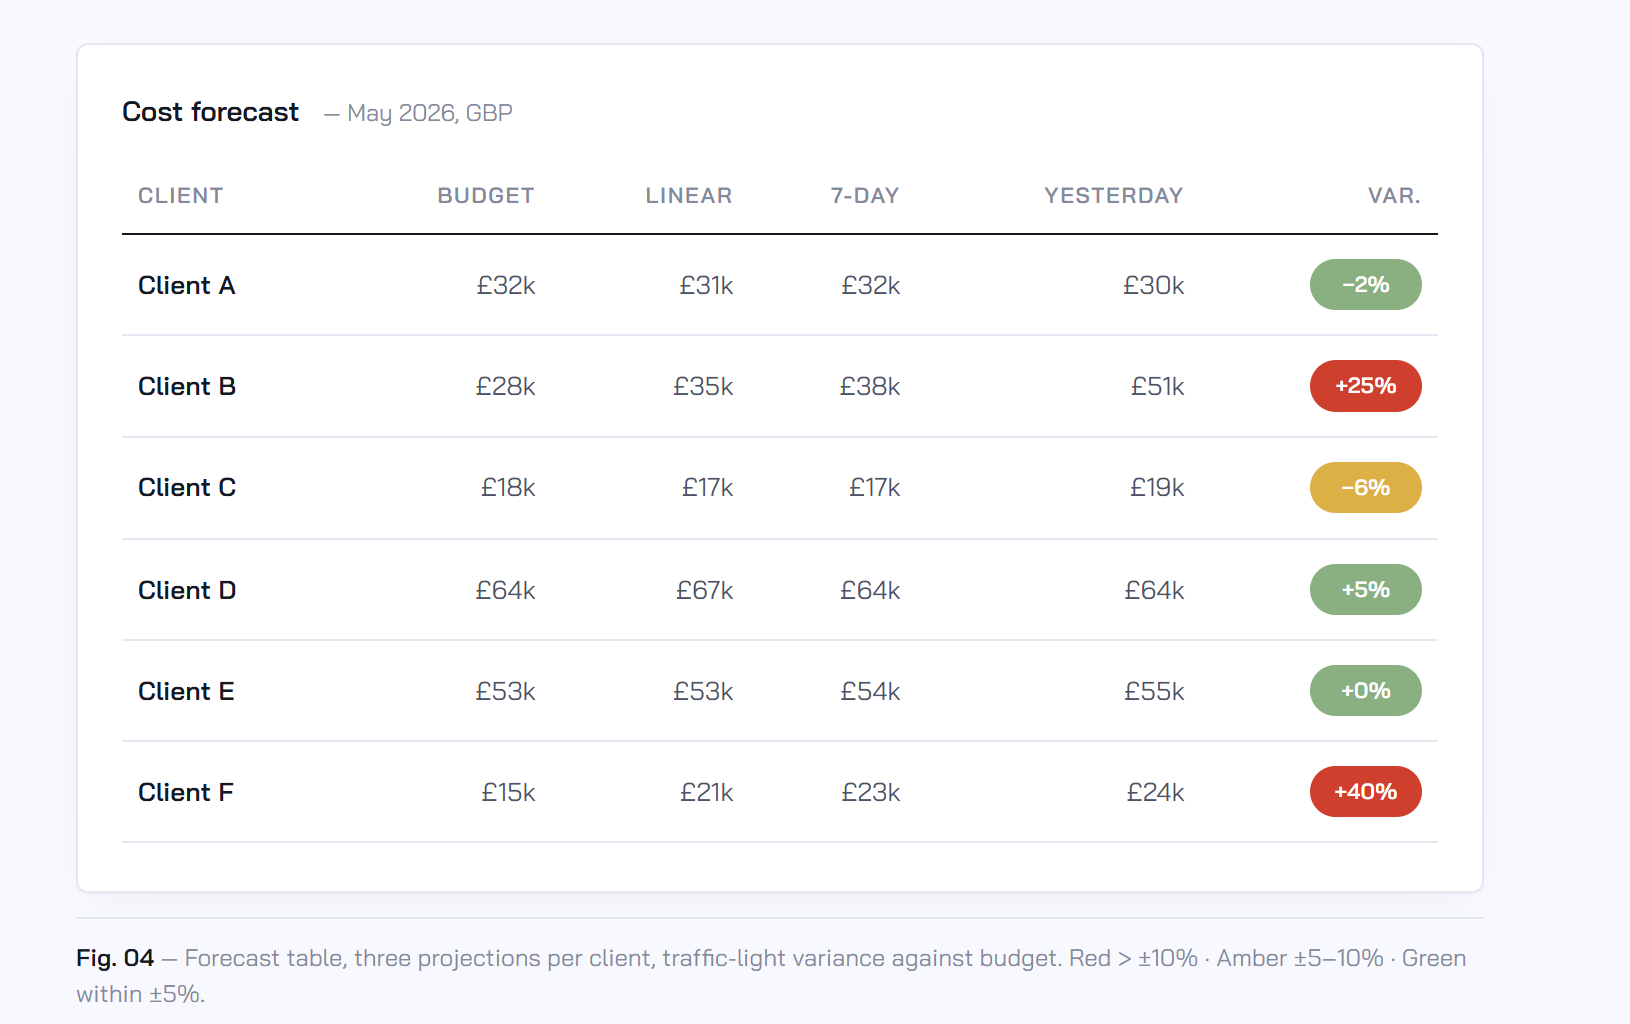
4) Triple Layer Forecasting
Pacing problems are easiest to fix mid-month, but most agencies only look at a single linear projection. We run three simultaneously to ensure we have the full picture:
Linear Projection: Assumes the rest of the month behaves like the start.
Rolling 7-Day: Captures recent momentum and shifts in pace.
The Yesterday Test: Shows where we would land if yesterday’s spend repeated every day for the rest of the month.
We compare all three against your monthly budget with a strict traffic light variance. Green sits within 5% of the goal, while red indicates anything wider than 10%. This triple layer view means a single day’s anomaly won’t trigger a false alarm, but a genuine trend will be caught on day eight, not day twenty-eight.
5) Eight Platforms, One Single Truth
Most teams waste hours jumping between eight different interfaces to piece together performance. This creates lag and means critical context is often lost in the shuffle. Our dashboard solves this by pulling data from Google, Meta, Microsoft, TikTok, LinkedIn, Pinterest, Apple and Reddit into one single view.
This gives our team a holistic look at how your budget is performing across the entire ecosystem. We manage the technical complexity and the API pipelines behind the scenes so that when we speak to you the focus remains squarely on strategy and growth. We are not spending our time explaining why a campaign went dark or reconciling data gaps. We are spending our time optimising for your next win.
Why this matters for your growth
We did not build this dashboard just to have a better view of the numbers. We built it because reactive management is a silent drain on your investment.
When an agency relies on weekly reports to catch issues, you are already days behind the problem. You are paying for the time it takes them to notice the error, the time it takes them to ask the right questions and the lost revenue that occurred while they were busy looking elsewhere.
At Addesu we use our technology to move faster than the market. Because we consolidate every platform into one view and automate the error detection, we solve problems before they show up in your bottom line. We provide the guardrails that allow you to scale with confidence knowing that everything is being watched in real time. We handle the technical complexity so you can spend your energy on the strategy that actually drives your business forward.
If you liked what you saw, please find here some other articles which we believe will be useful for you: